이렇게 PATH를 잡아주지만, fetch not found 에러가 발생하기에 다른 방식으로 PATH를 잡아주었다.
depot_tools/ninja.py: Could not find Ninja in the third_party of the current project, nor in your PATH.
상기와 같이 Could not find Ninja발생시에는 간단하게 설치해주면 된다.
apt install ninja-build
reproduce
1.git checkout [hash]
2.gclient sync -D (위 hash에 해당하는 버전으로 sync)
3. ./tools/dev/gm.py x64.debug --gdb --gdbjit 로 gdb옵션주어서 재빌드-> deprecated
그냥 아래의 방법으로 하면됨(debug 빌드 예시 + 옵션은 쪼매 만진거)
$ cd v8/buildtools/linux64
$ ./gn args out/x64.debug

#add
is_debug=true
symbol_level=2
v8_enable_gdbjit=true
v8_enable_backtrace=true
# 각 기능부별 추적 기능 args

#rebuild
rm -rf out/x64.debug
tools/dev/gm.py out/x64.debug
debug 빌드는 x64.debug, release 빌드는 x64.release
4.이후에 ./d8 에 바로밑에 snippet js파일로 생성해서 그대로 넣고 디버깅해보기
cd out.x64.debug
gdb-peda ./d8
run reproduce.js
---------------------------------------------
본인이 자주쓰는 방법은 아래와 같다.
git checkout <hash>

gclient sync -D

out/x64.release/args.gn수정

더 안정적으로 구현되기 위한 코드 적용

/v8/v8 디렉터리로 이동후 ./tools/dev/v8gen.py x64.release

ninja -C ./out.gn/x64.release 로 빌드하기
본인은 구황작물이며 처음으로 IIoT 관련 논문을 번역하며 읽어보게 되었기에 많은 지적 부탁드리겠습니다.
Abstract
산업사물인터넷(IIoT)의 도입으로 cyber physical system (CPS) 구성요소의 연결이 점차 늘어나고 있다. CPS 시스템들에 대한 복잡하고 기술적인 사이버 공격들이 제로데이 취약점을 통해 공격하기 때문에 IIoT 취약점 분석이 주요한 문제가 되었다. 그러나 현재 취약점 분석을 위한 화이트박스 기법은 다양한 제조사에서 제공하는 장비와 다양한 펌웨어 버전을 사용하는 실제 이기종 환경에서는 사용하기 어렵다. 따라서 본 논문에서는 이기종 환경에 적용할 수 있는 새로운 프로토콜 퍼징 테스트 기법을 제안한다. 시드 구성은 블랙박스 테스트의 결과에 큰 영향을 미칠 수 있으므로 seed와 비교하여 다른 프로그램 경로를 이동하는 테스트 케이스들을 통해 시드 풀을 업데이트한다. 입력, 출력, 델타 시간은 블랙박스 환경에서 새로운 프로그램의 영역이 검색되었는지 확인하는 데 사용한다. 필자는 제안된 제안의 유효성을 실험을 통하여 검증하였다.
[이기종 환경(heterogeneous environment) : 여러 처리 장치를 포함 환경]
[ 시드(seed) : test case를 만들기 위해 사용되는 input]
[ 델타시간(delta time) : 실제로 실행되는데에 프로그램이 걸리는 시간을 측정한 것]
1. Introduction 산업 제어 시스템(ICS)에 산업용 사물인터넷(IIoT) 장치가 등장하면서 다양한 cyber physical system(CPS) 구성 요소 간의 연결과 그에 따른 통신이 급격히 증가하였다. 이를 통해 정보 교환은 물론 제조 시스템의 생산성도 크게 향상되었다.
[CPS : 가상의 세계와 물리적 실체가 결합된 시스템]
[ICS(industrial control system : SCADA, DCS 등 산업 부분 및 하부구조에서 자주 사용되는 여러가지 형태의 제어시스템으로 아날로그 및 디지털 데이터를 측정하는 센서부, 이력 데이터를 획득하는 입력부, 운전자가 이상상황의 감지 및 대응을 위한 HMI로 구성]
[SCADA : 산 업 공정/기반 시설/설비를 바탕으로 한 작업공정을 감시하고 제어하는 컴퓨터 시스템]
[DCS : 한 대의 컴퓨터에 프로세스 데이터의 입력, 출력 및 플랜트의 감시, 조작, 제어 등을 모두 집중화 시켜 관리하는 시스템]
그러나, 네트워크 연결의 증가로 인한 결과로 CPS를 대상으로 한 attack surface 역시 확장되었다. 게다가 이란의 핵 프로그램을 마비시킨 것으로 알려진 스턱스넷(Stuxnet)이 밝혀진 이후 산업 제어 시스템에 대한 공격은 더욱 교묘해졌다. 예를 들어, 2016년 12월 우크라이나 키예프 시에서 정전을 일으킨 'Crashoverride' 악성 코드는 대상 환경에 전용 프로토콜 트래픽을 생성하고 가짜 메시지를 보내 대상 시스템을 비활성화했다. 이 공격의 특징 중 하나는 네트워크 모니터링을 피하기 위해 정상적인 트래픽으로 위장한다. "Crashoverride"의 이러한 모든 작업은 대상 제품의 원데이 취약점을 악용한다. 그렇기에 산업 제어 시스템의 보안에 대한 필요성은 강조되고 있다.
현재 IIoT에 대한 정교한 악성 코드 공격에 대처하는 주제에 대한 많은 연구가 가능하다. IIoT를 위한 침입탐지, 침입방지 시스템 등 다양한 기술이 제안되었으나 가용성을 고려하여 실제 시스템들에는 적용되지 않고 있다. IIOT 디바이스의 설치에 대한 비용은 취약점들이 발견되더라도, 대체하거나 업그레이드하기에 너무 많이 소요된다. 그렇기에 대부분의 벤더사에서는 자신들의 IIOT 장비들을 fuzzing test를 수행한 이후에 제공한다. 그럼에도 불구하고 새로운 취약점들을 매일 지속적으로 발견된다.
이러한 문제를 해결하기 위해 새로 발견된 IIoT의 취약점을 해결하기 위한 보다 효과적인 분석 방법을 개발하기 위한 연구가 진행하였다. 대부분의 연구에서는 화이트 박스나 그레이 박스 기반의 테스트를 사용하여 최적화된 테스트 케이스를 생성한다. 그러나, 이러한 테스트 툴들은 디바이스나 소프트웨어의 사전 분석에 매우 많은 시간을 요구하기에 부적절하다. 대부분의 CPS security manager는 IIOT 디바이스들의 소스코드에 접근할 수 없다. 그러므로 화이트박스 기반의 테스트는 적절하지 않다. 이러한 장치들에는 다양한 제조업체의 다양한 펌웨어 버전이 있다. 그레이박스 테스트 역시 실질적으로 사용가능하지 않다. 그렇기에 블랙 박스 기반의 테스팅이 가장 IIOT에 적합하다.
본 연구에서는 IIoT 프로토콜에 대한 블랙박스 기반 퍼징 테스트를 최적화할 수 있는 새로운 test evaluation parameter들을 제시한다. 실험에 따라 접근 방식을 통해 IIoT 프로토콜 퍼징 테스트의 시드 선택 프로세스를 개선하여 사전 분석 시간을 최소화할 뿐만 아니라, 효과적인 테스트 케이스를 신속하게 생성하여 블랙박스 테스트의 효율성을 높이는 기술을 제안한다. IIoT 보안 개선을 위한 필자들의 주요한 기여는 하기와 같다.
- 블랙박스 기반 테스트에서 새로운 프로그램 영역을 탐지하기 위해 시드 풀을 업데이트하는 새로운 프로토콜 퍼징 프레임워크가 개발되었다.
- 새 프로그램 경로가 발견되었는지 확인하는 인덱스 역할을 하는 일부 매개변수가 제안된다.
- 제안된 프로토콜 퍼징 프레임워크의 효율성은 기존 블랙박스 기법과의 비교를 통해 '라인 커버리지'와 '브랜치 커버리지'를 통해 검증된다.
본 논문의 나머지 부분은 다음과 같이 구성된다. 2장에서는 관련 연구와 기초 지식에 대하여 논한다. 3장에서는 제안하는 블랙박스 퍼징 프레임워크를 소개하고, 4장에서는 제안하는 기법의 세부 내용과 타당성에 대하여 논한다. 마지막으로, 5장에서는 몇 가지 결론을 제시하고 향후 연구 방향에 대하여 논한다.
2 Background
2.1 Vulnerability analysis techniques
널리 알려진 취약점 분석 기술 중 하나인 퍼징 테스트는 소프트웨어 시스템에 비정상적인 값을 주입하여 소프트웨어의 비정상 상태를 유발시키는 무작위 테스트 방법이다. 이 테스트의 목적은 프로토콜 구현의 취약점을 찾는 것이며 최근에 수행된 수많은 연구의 중점이었다. 추가적으로, 효율적인 테스트 케이스 생성을 위해 symbolic execution에 초점을 맞춘 연구도 진행되었다. 이러한 연구들은 대상 소프트웨어를 분석함으로써 최적의 테스트 케이스를 도출할 수 있지만, 각 디바이스나 소프트웨어가 서로 다른 제조업체에서 출시되었을 수도 있는 실제 환경에서 실제로 화이트박스 또는 그레이박스 테스트를 수행하는 것은 어렵다. 더 나아가, 각 디바이스나 소프트웨어의 펌웨어 버전 역시 다를 수 있다. 그렇기에, 실제로 산업 제어 시스템을 관리하는 관리자가 이러한 방법을 사용하여 시스템의 보안을 확인하는 것은 매우 어렵다. 이 맥락에서 "Shapiro’s work"와 "netzob"는 최소한의 지식으로도 수행할 수 있기에 가장 좋은 선택이다. 본 연구에서는 프로토콜의 사양을 분석할 필요가 없으므로 IoT 환경에서 운용 시 효과적일 것으로 기대된다. 그러나, 자동화 프로토콜에 대한 리버싱의 정확도는 프로토콜 분야를 구별할만큼 충분하지 않기에 추가적인 연구를 필요로 한다.
[symbolic execution : 프로그램 상태와 관련한 메타데이터 정보를 추적해 프로그램 상태(program state)가 어떻게 변화되며 다른 프로그램 상태에 어떻게 도달할 수 있는지 추론]
현재 테스트 케이스들은 일반적으로 대상 프로토콜 표준을 기반으로 생성된다. 프로토콜 명세를 기반으로 IIoT 프로토콜 취약점 분석을 위한 수많은 연구들이 수행되었다. Peng은 'Modbus' 프로토콜 취약점 분석에서 입력 값을 무작위로 생성하기 전에 경계 값을 검증하는 기술을 사용하였다. SungJin Kim은 중첩된 구조를 갖는 manufacturing message specifcation (MMS) 프로토콜의 취약점을 분석하였다. 그의 기술은 대상 프로토콜 명세 기반으로 테스트 케이스를 생성하여 여러 장치의 취약점 분석을 신속하게 수행할 수 있다는 장점이 있다. 하지만, 이 기법은 대상 시스템의 동작을 고려하지 않기 때문에 비효율적인 테스트 케이스를 생성할 수 있다.
[Modbus 프로토콜 : Modicon이라는 회사에서 만든 직렬통신 프로토콜로써 공장 자동화에 사용되는 PLC 통신을 위해 만들어짐]
[MMS 프로토콜 : 통신망으로 연결된 자동화기기와 컴퓨터 응용 프로그램간에 실시간 데이터와 감시제어정보를 교환하기 위한 국제 표준의 메시지 교환 규약]
최근의 퍼징 연구에서는 효율적인 테스트 케이스를 개하기 위해 code coverage와 같이 프로그램의 동작을 고려하는 테스트 케이스 평가 지표를 사용했다. 그러나, 현재 대부분의 평가 지표들 화이트 박스 및 그레이 박스 테스트에만 적용 가능하다. 그렇기에 블랙박스 테스트를 위해서는 새로운 평가지표를 필요로 한다. 다양한 연구에서 현재 참조되고 있는 취약점 분석 테스트에 대한 평가지표는 하기와 같다.
2.2 Evaluation indexes of vulnerability analysis
취약점 분석 테스트의 유효성은 취약점 분석 평가 지표를 통해 평가 수 있다. 지표들은 (1) 대상 소프트웨어의 함수가 몇 번 수행되었는지를 나타내는 method coverage, (2) 얼마나 많은 소스 코드 영역이 실행되었는지를 나타내는 line coverage, (3) 분기문의 실행 정도를 나타내는 branch coverage를 포함한다. 최근의 연구들에서는 더 적은 수의 테스트 케이스들로 높은 code coverage를 충족하는 것이 강조되었다. 특히 일부 지표(상기의 (1),(2),(3))들 테스트 중에 code coverage를 지속적으로 확인하고 해당 정보를 사용하여 새로운 테스트 케이스를 생성한다. 이러한 지표에 대한 간략한 설명과 장점 및 단점이 아래에 나와 있다.
[code coverage : 소프트웨어 테스트에서 사용되는 지표 중 하나로, 코드의 실행 여부를 기반으로 코드의 품질과 완성도를 측정하는 방법]
2.2.1 Method coverage (function coverage)
Method coverage 지표는 타 소프트웨어의 함수(method)가 몇 개나 테스트되었는지를 나타낸다. 이 지표를 측정하기 위해선, 타겟 소프트웨어의 소스코드에 대한 바이너리 분석이 요구된다. 따라서 이 지표는 블랙박스 기반 테스트에는 적합하지 않다. 이 지표에 대한 또 다른 문제점은 메소드가 여러 줄의 소스 코드로 구성된 경우, 해당 메소드의 소스 코드 중 몇 줄만 실행되더라도 해당 메소드가 실행되었다고 결론 지 수 있다. "Skyfire fuzzer"는 이 지표의 유효성을 검증하기 위해 line coverage와 function coverage를 모두 사용하여 결과를 분석했으며, line coverage가 method coverage보다 버그 탐지 가능이 더 높다는 것을 확인하였다.
2.2.2 Code coverage—line coverage
라인 커버리지(L-Cov)는 테스트 케이스가 얼마나 많은 라인을 거쳤는지 평가하는 가장 널리 알려진 취약점 분석 지표이다. 대상 소프트웨어 소스 코드의 어느 부분에 취약점이 존재하는지 알기는 현실적으로 어렵기 때문에 line coverage는 가장 직관적인 평가 지표이며, 많은 연구에서 제안된 그들의 기법에 대한 성능을 입증하기 위해 사용하였다.그러나, line coverage는 특정 분기문에만 존재하는 취약점에 대해 전혀 고려하지 않는다는 단점이 있다.
Seelix와 같은 mutation기반의 테스트는 line coverage를 사용하며 타겟의 증가된 coverage를 고려하여 다음 입력 값을 생성하는 기술을 적용한다. code coverage 기반의 seed 선택 방법은 전반적인 테스트의 효율성을 향상시키기 위해 사용되어왔으나, 여전히 라인 커버리지 문제를 안고 있다.
2.2.3 Code Coverage—branch coverage
Line Coverage와 유사한 Branch Coverage(B-Cov)는 문헌에서 가장 일반적으로 사용되는 평가 지표이다. 이 지표는 타겟 프로그램의 모든 분기문 중 몇 개의 분기문이 실행되었는지를 평가하므로, 프로그램이 실행되는 동안 몇 개의 시나리오를 확인했는지를 나타낼 수 있다. 특히 소프트웨어 오류 처리 구문들이 얼마나 많이 통과되었는지 확인할 수 있으므로 라인 커버리지보다 더 나은 지표로 간주된다. Line coverage와 branch coverage는 모두 화이트 박스 테스트에서만 활용가능하다.
2014년 공개된 'Kameleon Fuzz'는 XSS 취약점을 찾기 위해 유전자 알고리즘(GA)을 활용해 자동으로 테스트 케이스를 생성하는 블랙박스 퍼징 도구이다. GA 적합도 함수에 대한 매개변수의 일부로 '새 페이지'와 '매크로 상태'를 사용하여 애플리케이션 적용 범위를 늘리는 테스트 케이스들을 개발하였다. 따라서, 이 도구는 프로그램 경로와 관련된 매개변수를 사용하여 테스트 케이스의 효율성을 높인다. 이러한 매개변수들은 제한된 정보만 사용할 수 있는 블랙박스 테스트에 사용할 수 있다. 그러나, 이러한 매개변수(예: 새 페이지 및 매크로 상태)에 대한 정보는 해당 장치에 고도로 최적화된 임베디드 장치로 인해 IIoT 장치의 블랙박스 테스트에서 수집하기 어렵다. 따라서, IIoT에는 앞서 언급한 한계를 극복할 수 있는 포괄적인 블랙박스 테스트 기술이 필요하다. 본 연구에서는 이러한 목적을 달성하기 위해 code coverage와 긍정적인 상관관계를 가지며 완전한 블랙박스 환경에서 작동할 수 있는 요소들을 분석했다.
[유전자알고리즘(genetic algorithm) : 초기 입력을 주고 변형시키며 최적의 결과를 나타내는 값을 찾아내는 방법]
[적합도 함수(Fitness function) : 문제를 해결하기 위한 유전자의"좋음"의 척도를 구하는 함수]
상기에서 언급한 바와 같이 최근 취약점 분석 연구는 바이너리 동적 분석 기법을 활용하여 테스트 케이스를 생성하여 효율성을 높이는 데 중점을 두고 있다. 경우에 따라, 성능 측정으로 사용되는 지표를 활용하여 테스트 케이스의 효율성을 극대화한다. 그러나, 대부분 이러한 기술은 화이트 박스 또는 그레이 박스 테스트에만 사용할 수 있다. 블랙박스 테스트 환경에서 유사한 접근방식을 사용한 일부 연구들이 있더라도 이러한 테스트가 완전한 블랙박스 기반 테스트라고 볼 수는 없다. 따라서, 본 연구에서는 블랙박스에서 사용할 수 있는 테스트 평가 지표를 찾아 이를 기반으로 시드를 추가함으로써 블랙박스 기반 테스트의 문제점을 해결하는 새로운 스마트 시드 선택 기반의 퍼징 테스트 프레임워크를 제안한다.
3 Smart seed selection‑based fuzzing
제안하는 블랙박스 테스트 기법을 논의하기에 앞서, 각 소스코드 영역에서 취약점이 발견될 확률을 고려해본다. 소스코드 영역을 취약점 발견 확률이 높은 영역과 그렇지 않은 영역으로 분류하는 것이 가능한가. 더 나아가, 널리 사용되는 간단한 방법을 구현한 소스코드 영역에서는 덜 친숙한 방법을 구현된 영역에 비해 취약점을 발견할 확률이 낮다. 소스코드에 대한 접근을 허용하면 취약점 발견 가능성이 높은 영역을 구분할 수 있다. 그러나, 블랙박스 테스트에서는 이 경우가 해당되지 않는다.
블랙박스 기반 취약점 분석은 주로 '공격 문법'이 적용된 테스트 케이스를 생성하고 테스트 케이스들을 입력값으로 타겟 시스템에 주입한다. 이는 시드 풀의 구성이 이상적이지 않으면 프로그램의 일부 영역만 테스트될 수 있다. 공격 문법이 아무리 좋더라도 초기 시드의 구성이 잘못되면 프로그램의 특정 영역만 검색하게 된다. 따라서 취약점이 발견될 확률은 매우 낮다. 이 문제를 해결하기 위해 우리는 그림 1과 같은 퍼징 테스트 프레임워크를 제안한다. 프레임워크의 각 단계는 아래에 설명되어 있다.
1단계: 시드풀 생성
시드 기반의 테스트 케이스 생성에서 시드 풀은 공격 문법이 적용되기 전에 준비해야 하는 정상 및 비정상 입력의 집합이다. 시드 풀의 구성이 이상적이지 않은 경우 테스트 케이스는 소프트웨어의 제한된 영역만 통과할 수 있으며, 이는 테스트 결과에 영향을 미칠 수 있다. 본 연구에서는 테스트 도중에도 시드 풀을 업데이트하는 방법을 제안한다.
2단계: 시드풀로부터 새로운 시드를 선택
시드 풀에서는 테스트 케이스 생성에 사용될 시드를 선택한다. 선택한 시드가 공격 문법에 따라 더 많은 테스트 케이스를 생성할 수 있는지 확인해야 한다. 모든 공격 문법이 해당 시드에 적용되었다면 다른 시드를 선택해야 한다.
3단계: 테스트 케이스를 생성 및 주입
이 단계에서 퍼저는 선택된 시드에 공격 문법을 적용하여 테스트 케이스를 생성한다. 예를 들어 공격 문법은 시드의 일부 필드를 임의의 값으로 변경한다.
그 후, 퍼저는 이 테스트 케이스를 테스트 중인 장치(DUT)에 입력하고 테스트 케이스에 대한 타겟의 반응을 모니터링한다. 모니터링의 결과물은 로그로 저장된다. 타겟 시스템에서 memory leak이나 software crashes를 모니터링하는 것이 실용적이지 않은 경우, Fuzzer는 응답 시간 및 출력과 같은 대상 시스템의 출력만 관찰한다. memory leak , software crashes 등과 같은 자세한 프로세스 정보는 취약점에 대한 강력한 단서를 제공한다. 그러나 산업 제어 시스템에서는 이를 포착하기가 어렵다.
[Device under test(DUT) : 테스트 중인 장치]
4. 어떻게 테스트 케이스가 소프트웨어를 탐험하는지 확인
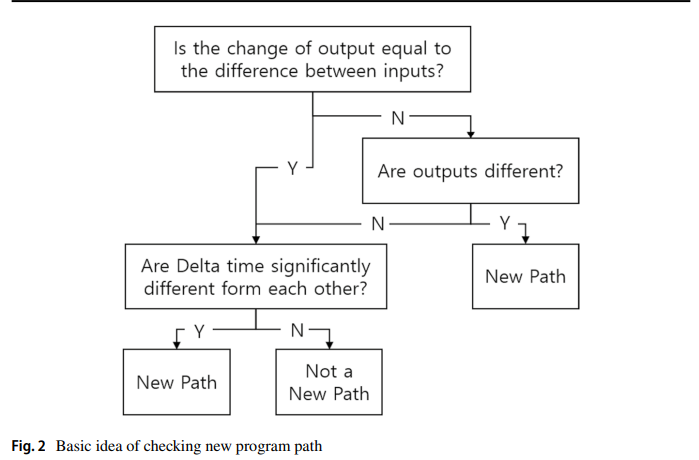
마지막으로 4단계에서는 테스트 케이스가 새로운 영역을 조사했는지 여부를 검증한다. 테스트 케이스가 새로운 영역을 통과한 경우, 새로운 시드로 시드 풀에 추가된다. 제안된 프레임워크와 기존 블랙박스 기반 취약점 분석 도구의 차이점은 실험 중에 시드를 추가하여 검사할 프로그램 영역을 확장한다는 점이다. 이러한 반복에 있어서 테스트 케이스가 새로운 프로그램 영역을 통과했는지 확인하는 것이 중요하다. 일반적으로 화이트박스 기반 테스트에서는 line coverage, branch coverage 등의 지표를 사용할 수 있다. 그러나 2장에서 살펴본 것처럼 블랙박스 퍼징에서는 해당 지표를 사용할 수 없다. 따라서 본 연구에서는 line code coverage나 branch coverage 대신에 입력값, 출력값, 소요시간(델타타임)을 기반으로 테스트 케이스가 새로운 프로그램 영역을 검색하는지 여부를 판단하는 새로운 방법을 사용한다. 프로그램 영역 탐색 추론 방법은 아래 그림 2와 같이 수행된다.
4 Evaluation
앞서 언급되어 있듯이 블랙박스 기반 퍼징 테스트에서는 code coverage를 지표로 사용할 수 없다. 따라서 본 연구에서는 code coverage 수치에 대한 기능을 복제하는 또 다른 지표를 구현했다.
본 연구에서 사용된 새로운 지표는 입력, 출력, 델타 시간이다. 이는 화이트 박스 테스트에서 code coverage가 수행하는 역할을 채울 수 있다. 이번 장에서는 이러한 지표의 측정에 대해 논의하고 그 효과를 실험적으로 증명한다. 또한 무작위로 선택된 테스트 케이를 사용하여 IoT 장치에 주로 사용되는 Modbus 프로토콜과 필자의 접근 방식을 비교 분석했다. 결과 분석의 편의성을 위해 Ubuntu 18.04를 사용하는 Modbus server 와 Modbus client 를 가상머신을 이용하여 구축하였다. 가상머신 환경에서는 IoT 환경의 저전력, 저성능을 고려하여 서버와 클라이언트 모두 단일 프로세서에 1GB의 메모리를 갖도록 설정하였다.
4.1 Input/output
프로토콜 퍼징의 특성으로 인해 대부분의 경우 출력은 입력과 많은 연관성을 갖는다. 서버에 대한 취약점 분석이 수행되면, 테스트 장치(TD)는 요청 메시지를 보내며 DUT는 요청 메시지를 처리하고 응답 메시지를 TD로 전송한다. 반대로, DUT가 클라이언트인 경우, 정상적인 응답 메시지에 대한 응답은 TD에 의해 전송되지 않는다. 그러나 대부분의 프로토콜은 클라이언트가 비정상적인 응답을 받으면 오류 메시지를 보내도록 설계되었다. 따라서 입력 값과 출력 값은 대상 시스템의 취약점 분석과 밀접한 관련이 있다.
입력값의 변화에 따른 출력값의 변화는 크게 3가지로 분류할 수 있다. 첫 번째 유형에서는 일부 입력 필드가 출력의 특정 필드에서 직접 사용된다. 두 번째에서는 입력이 바뀌어도 출력은 동일하다. 이 두 가지 경우에는 다른 프로그램 영역이 실행되는지 여부를 알 수 없다. 하지만 동일한 소스코드 영역에서 출력이 생성된 것으로 유추할 수 있다. 위의 두 가지 유형과 달리 세 번째 유형에서는 입력의 변화와 출력의 변화가 크게 다르다. 이 경우 새로운 프로그램 영역에서 출력이 생성되었음을 명확하게 확인할 수 있다. 이 세 가지 경우를 구별하기 위해 다음 방법을 사용하여 비유사성을 계산한다.
차이점은 "시드와 테스트 케이스의 입력 값의 차이"와 "시드의 출력 값과 테스트 케이스의 차이"의 비율이다. 대부분의 IIoT 프로토콜은 필드를 바이트 단위로 구별하기 때문에 이러한 차이는 바이트 단위로 계산된다. 필드의 길이가 다른 경우 짧은 길이의 필드에 zero padding이 적용되고 계산이 수행된다. 입력 값과 출력 값이 서로 독립적인 경우에만 비유사성은 0아다. 입력값에 비례하여 출력값이 변하면 1이 된다. 반면, 입력 값과 출력 값이 상당히 다른 경우 차이점은 그 차이에 비례한다.
표 1은 제안된 차이점의 유효성을 검증힌다. 일반적인 wrtie single register를 기반으로 주소 필드와 값 필드를 변경하는 실험의 일부이다.
오픈소스 libmodbus의 동작을 확인한 결과, Test1과 Test2는 시드와 동일한 함수 호출을 가지고 있는 반면, Test3은 허용되지 않은 주소 접근 시 오류 처리 기능이 동작하는 것으로 확인되었다. 마찬가지로, 각 테스트의 비유사성 값은 1 또는 1보다 크다.
그림 3은 표 1의 실험 결과를 산출한 함수 호출 그래프를 보여준다. Test1과 Test2의 경우 _modbus_tcp_repa response_tid 함수에서 직접 메시지가 전송된다. Test 3의 경우 오류 처리를 위한 함수를 호출한 후 메시지를 전송하는 것을 확인하였다. 따라서 입력과 출력의 차이를 통해 서로 다른 코드 영역이 실행되었는지 여부를 실험적으로 확인할 수 있다.
입력과 출력을 이용하여 차이점을 확인한 후 새로운 프로그램을 통과하지 못한 것으로 판단된 테스트 케이스에 대해 delta time 기반의 프로그램 경로 분류를 수행한다. 프로그램 영역을 검색하는 시점이 다르다면, 다른 영역에서 검색이 이루어졌음을 유추할 수 있음은 분명하다. 그러나, delta time은 OS 스케줄링, network jitter 등으로 인해 발생하는 노이즈의 영향을 받을 수 있다.
이 문제를 해결하기 위해 우리는 큰 수의 법칙을 사용한다. 이 정리는 무작위로 선택된 표본의 평균이 표본 크기가 증가함에 따라 전체 모집단의 평균으로 수렴된다는 것이다. 오류는 가우스 정규 분포를 따르는 것으로 가정된다. 여기서, 반복 테스트 횟수가 증가함에 따라 실제 delta time의 평균값은 다음과 같이 구할 수 있다.
동일한 함수 호출로 동일한 연산을 수행하므로 delta time은 거의 변하지 않는다. 따라서 delta time의 변화가 제한되어 있으므로 X도 가우스 정규 분포를 따른다. 따라서 n이 충분히 큰 경우 Avg(X)는 평균 delta time에 가깝다. 25번의 반복은 대수의 법칙에 충분하지 않다. 그러나 테스트 환경이 매우 정적이기 때문에 표본 평균은 X의 모집단 평균에 매우 가깝다. 따라서 본 연구에서는 25번의 반복을 통해 delta time을 측정한다. 실제 작업의 실험 결과는 그림 4에 나와 있다.
실험을 통해 얻은 delta time은 TD의 CPU clock을 기준으로 하고, 유용성을 위해 clock을 다수의 간격으로 나누어 데이터를 일반화하였다. 실험을 통해 노이즈에 따라 데이터의 변동폭이 큰 것으로 확인되었다. 네트워크 환경, 호스트 환경에 따라 다양한 요인으로 인해 노이즈가 발생할 수 있다. 본 실험에서는 가상머신을 이용하여 환경을 구축하였으므로, 가상머신을 운영하는 호스트의 다양한 프로세스로 인해 소음이 발생할 가능성이 있다.
그러나 이러한 높은 노이즈에도 불구하고 실험의 평균은 실험 결과를 구별할 수 있을 만큼 충분히 큰 차이를 보여준다. 이는 쓰기 단일 코일의 경우 0.002725, 다중 코일 쓰기의 경우 0.002263, 읽기 코일의 경우 0.002378이다. 그림 5는 그림 4의 테스트 결과를 분석하여 얻은 함수 호출 그래프를 보여준다. 함수 호출 그래프(그림 5)는 코일 읽기 및 쓰기 작업이 서로 다른 함수를 호출함을 보여준다. 이러한 함수 호출은 delta time에 반영된다. 따라서 delta time은 테스트가 새로운 프로그램 경로를 통과했는지 여부를 결정하는 효과적인 지표이다. 상이도와 delta time을 기반으로 새로운 프로그램 경로가 통과되는지 확인하는 알고리즘은 다음과 같다.
요약하면, 상이성 검사는 입력과 출력을 이용하여 새로운 프로그램 영역의 통과 여부를 판단하고, 검사는 delta time을 이용하여 수행한다. Delta time-based 결정은 상이성을 이용하여 위의 사항을 결정하기 어려운 경우에만 수행된다. Delta time determination의 경우 반복 횟수는 큰 수의 법칙이 적용될 수 있을 만큼 커야 한다. 출력의 변화가 입력의 변화와 관련이 없거나 delta time이 크게 다른 경우, 테스트 케이스가 코드에서 새로운 경로를 통과했다고 추론된다. 또한, 제안하는 기법을 이용하면 초기 시드 풀 구성이 잘못된 경우에도 테스트를 수행할 수 있다. 테스트 실행 시간이 지날수록 스캔되지 않은 프로그램 영역을 검색할 가능성이 높아진다.
[network jitter : 네트워크 연결을 통한 데이터 전송과 수신 사이의 시간 지연의 변화 ]
[큰수의 법칙(대수의 법칙) : 큰 모집단에서 무작위로 뽑은 표본의 평균이 전체 모집단의 평균과 가까울 가능성이 높다는 개념 ]
[delta time determination : 두 이벤트 또는 두 상태 간의 시간 간격을 결정하는 프로세스]
4.3 General result—code coverage
제안한 방법의 유효성을 검증하기 위해 기존의 블랙박스 기반 테스트와 동일하게 비교하였다. 테스트 타겟은 'Modbus' slave(서버)였으며 앞서 말씀드린 환경에서 테스트를 진행하였다. 시드 풀은 가장 간단한 Modbus 기능 중 하나인 단일 코일 쓰기의 일반 트래픽으로 구성되었다. 공격 문법은 (1) function code field, (2) address field (3) value field에 무작위 값을 주입하는 세 가지 유형으로 구성된다. Modbus는 단순 요청 응답 프로토콜이며 연결 지향적이지 않으므로 통신 순서를 고려하지 않는다. 테스트 결과는 'gcov'에 의한 code coverage와 branch coverage 지표를 이용하여 비교된다.
전통적인 블랙박스 테스트는 동일한 공격 문법을 사용했다. 그러나 시드 풀은 업데이트되지 않았다. 제안하는 방법은 메인 프레임워크를 변경하지 않고도 다양한 퍼징 도구에 적용 가능하다.따라서 우리는 제안된 아이디어의 유효성을 검증하는 데 중점을 두었다. 테스트의 결과는 표2에서 볼 수 있다.
기본적인 블랙박스 테스트 기준 line coverage는 46.43%, B-cov는 50.0%로 나타났다. 반면, 제안된 테스트 방법과 동일한 시드 풀을 사용한 경우 line coverage와 B-Cov는 각각 50.0%와 62.5%로 향상되었다. 따라서 기존 블랙박스 기법과 비교하여 제안한 방법이 분기 커버리지와 라인 커버리지가 12.5%, 3.57% 더 높은 것을 확인하였다. 추가된 새로운 시드 중 80%가 실제로 새로운 프로그램 영역을 통과하였다. 따라서 새로운 시드를 추가하는 것의 유효성도 확인되었다.
[gcov : GNU CC와 함께 사용해서 코드 커버리지 테스트를 수행할 수 있게하는 도구
본 연구에서는 입력, 출력, delta time을 기반으로 새로운 퍼징 프레임워크와 블랙박스 테스트를 제안하였다. 제안된 프레임워크는 본 논문에서 논의된 다른 척도에 직접적인 의존성이 없기 때문에 향후 블랙박스 기반 테스트에서 이러한 척도를 적용한다면 보다 효율적인 취약점 분석이 가능하다. 예를 들어, 이 연구에서는 입력과 출력의 차이에 대해 간단한 Euclidean distance comparison 를 사용하였다. 그러나 프로토콜 분야에 따른 binary distance를 사용하면 더 나은 결과를 얻을 수 있다.
4장에서는 제안된 아이디어의 유효성을 입증하였다. 테스트에 소요되는 시간과 관련하여 제안된 알고리즘은 아직 최적화되지 않았다. Delta time 기반 추론 논리는 상당한 시간을 소비하며 대부분의 테스트 사례가 이 논리를 거쳐간다. 테스트 시간을 개선하기 위해 향후 hypothesis test based algorithm이 생성될 수 있다. Delta time은 정규분포를 따르기 때문에 각 시드에 대해 95~99% 신뢰구간으로 계산이 가능하다. 추후에 테스트 케이스의 delta time이 시드의 신뢰 구간에 속하지 않는 경우에만 테스트 사례를 새로운 시드로 결정할 수 있다. 제안된 지표의 유효성은 IoT 환경에서 널리 사용되는 Modbus 프로토콜을 통해 검증되었다. 실험을 통해 상이성과 delta time이 잘 작동함을 확인하였고, 제안한 기법이 기존 블랙박스 테스트에 비해 동일한 시드를 사용하여 더 높은 코드 커버리지를 달성했음을 확인하였다.
[Euclidean distance comparison : 유클리드 거리를 사용하여 두 점 또는 벡터 간의 거리를 계산하고, 이를 기반으로 두 객체가 얼마나 유사한지를 비교하는 과정. 상이성을 체크하기 위해 사용]
[binary distance : 이진 벡터란 각 요소가 0 또는 1로 구성된 벡터. 이상 탐지를 위해 사용]
[hypothesis test based algorithm : 가설 검정(hypothesis testing) 기법을 사용하여 데이터를 분석하고 결정하는 방법론을 기반으로 한다.]